Part 1.2 Car Nd Masking and Colouring a Region of the Image
May 9, 2017 • Python Machine-Learning Computer-Vision • 4 minutes to read • Edit
In this part of Car-ND, we will look at how to mask and colour the region.
Table of Contents
1 Basic Math
Before I show you the code, let’s understand some (very) basic mathematics that are necessary to understand for this part
1.1 One Degree Polynomial
A polynomial equation looks something like this (lets call it equation 1):
2 Let’s Code
Let’s import all the necessary libraries
    import matplotlib.pyplot as plt
    import matplotlib.image as mpimg
    import numpy as np
    import sys
Now, let load in the image and get its shape and also while we are at it make a copy of the image. lets call the copies as color_select & line_image
    try:
        image = mpimg.imread('test.jpg')
    except FileNotFoundError as e:
        print(e)
        sys.exit(1)
    print('This image is: {}, with dimensions: {}'.format(type(image), image.shape))

    ysize = image.shape[0]
    xsize = image.shape[1]
    color_select = np.copy(image)
    line_image = np.copy(image)
Let’s initialize threshold values and a triangle coordinates.
    red_threshold = 200
    green_threshold = 200
    blue_threshold = 200
    rgb_threshold = [red_threshold, green_threshold, blue_threshold]

    # Init a triangle (this part is variable)
    left_bottom = [100, 525]  # [0, 539]
    right_bottom = [850, 550]  # [900, 539]
    apex = [460, 310]  # [475, 320]
Let’s get the threshold color image by taking RBG arrays of the image and getting all the values less then the predefined threshold values.
color_thresholds = (image[:, :, 0] < rgb_threshold[0]) | (image[:, :, 1] < rgb_threshold[1]) | (image[:, :, 2] < rgb_threshold[2])
Using Numpy’s polyfit (more on that here) at 1 degree
    fit_left = np.polyfit((left_bottom[0], apex[0]), (left_bottom[1], apex[1]), 1)
    fit_right = np.polyfit((right_bottom[0], apex[0]), (right_bottom[1], apex[1]), 1)
    fit_bottom = np.polyfit((left_bottom[0], right_bottom[0]), (left_bottom[1], right_bottom[1]), 1)
Using Numpy’s Meshgrid (more on that here), let’s create a mesh
xx, yy = np.meshgrid(np.arange(0, xsize), np.arange(0, ysize))
Getting the regional threshold is done by doing
    region_thresholds = (yy > (xx * fit_left[0] + fit_left[1])) & (yy > (xx * fit_right[0] + fit_right[1])) & (
    yy < (xx * fit_bottom[0] + fit_bottom[1]))
Before plotting the images, the final thing to do is
- Masking the threshold region based on the triangle
- And then masking the original image with the colored lines.
    # Mask color selection
    color_select[color_thresholds | ~region_thresholds] = [0, 0, 0]
    # Find where image is both colored right and in the region
    line_image[~color_thresholds & region_thresholds] = [255, 0, 0]
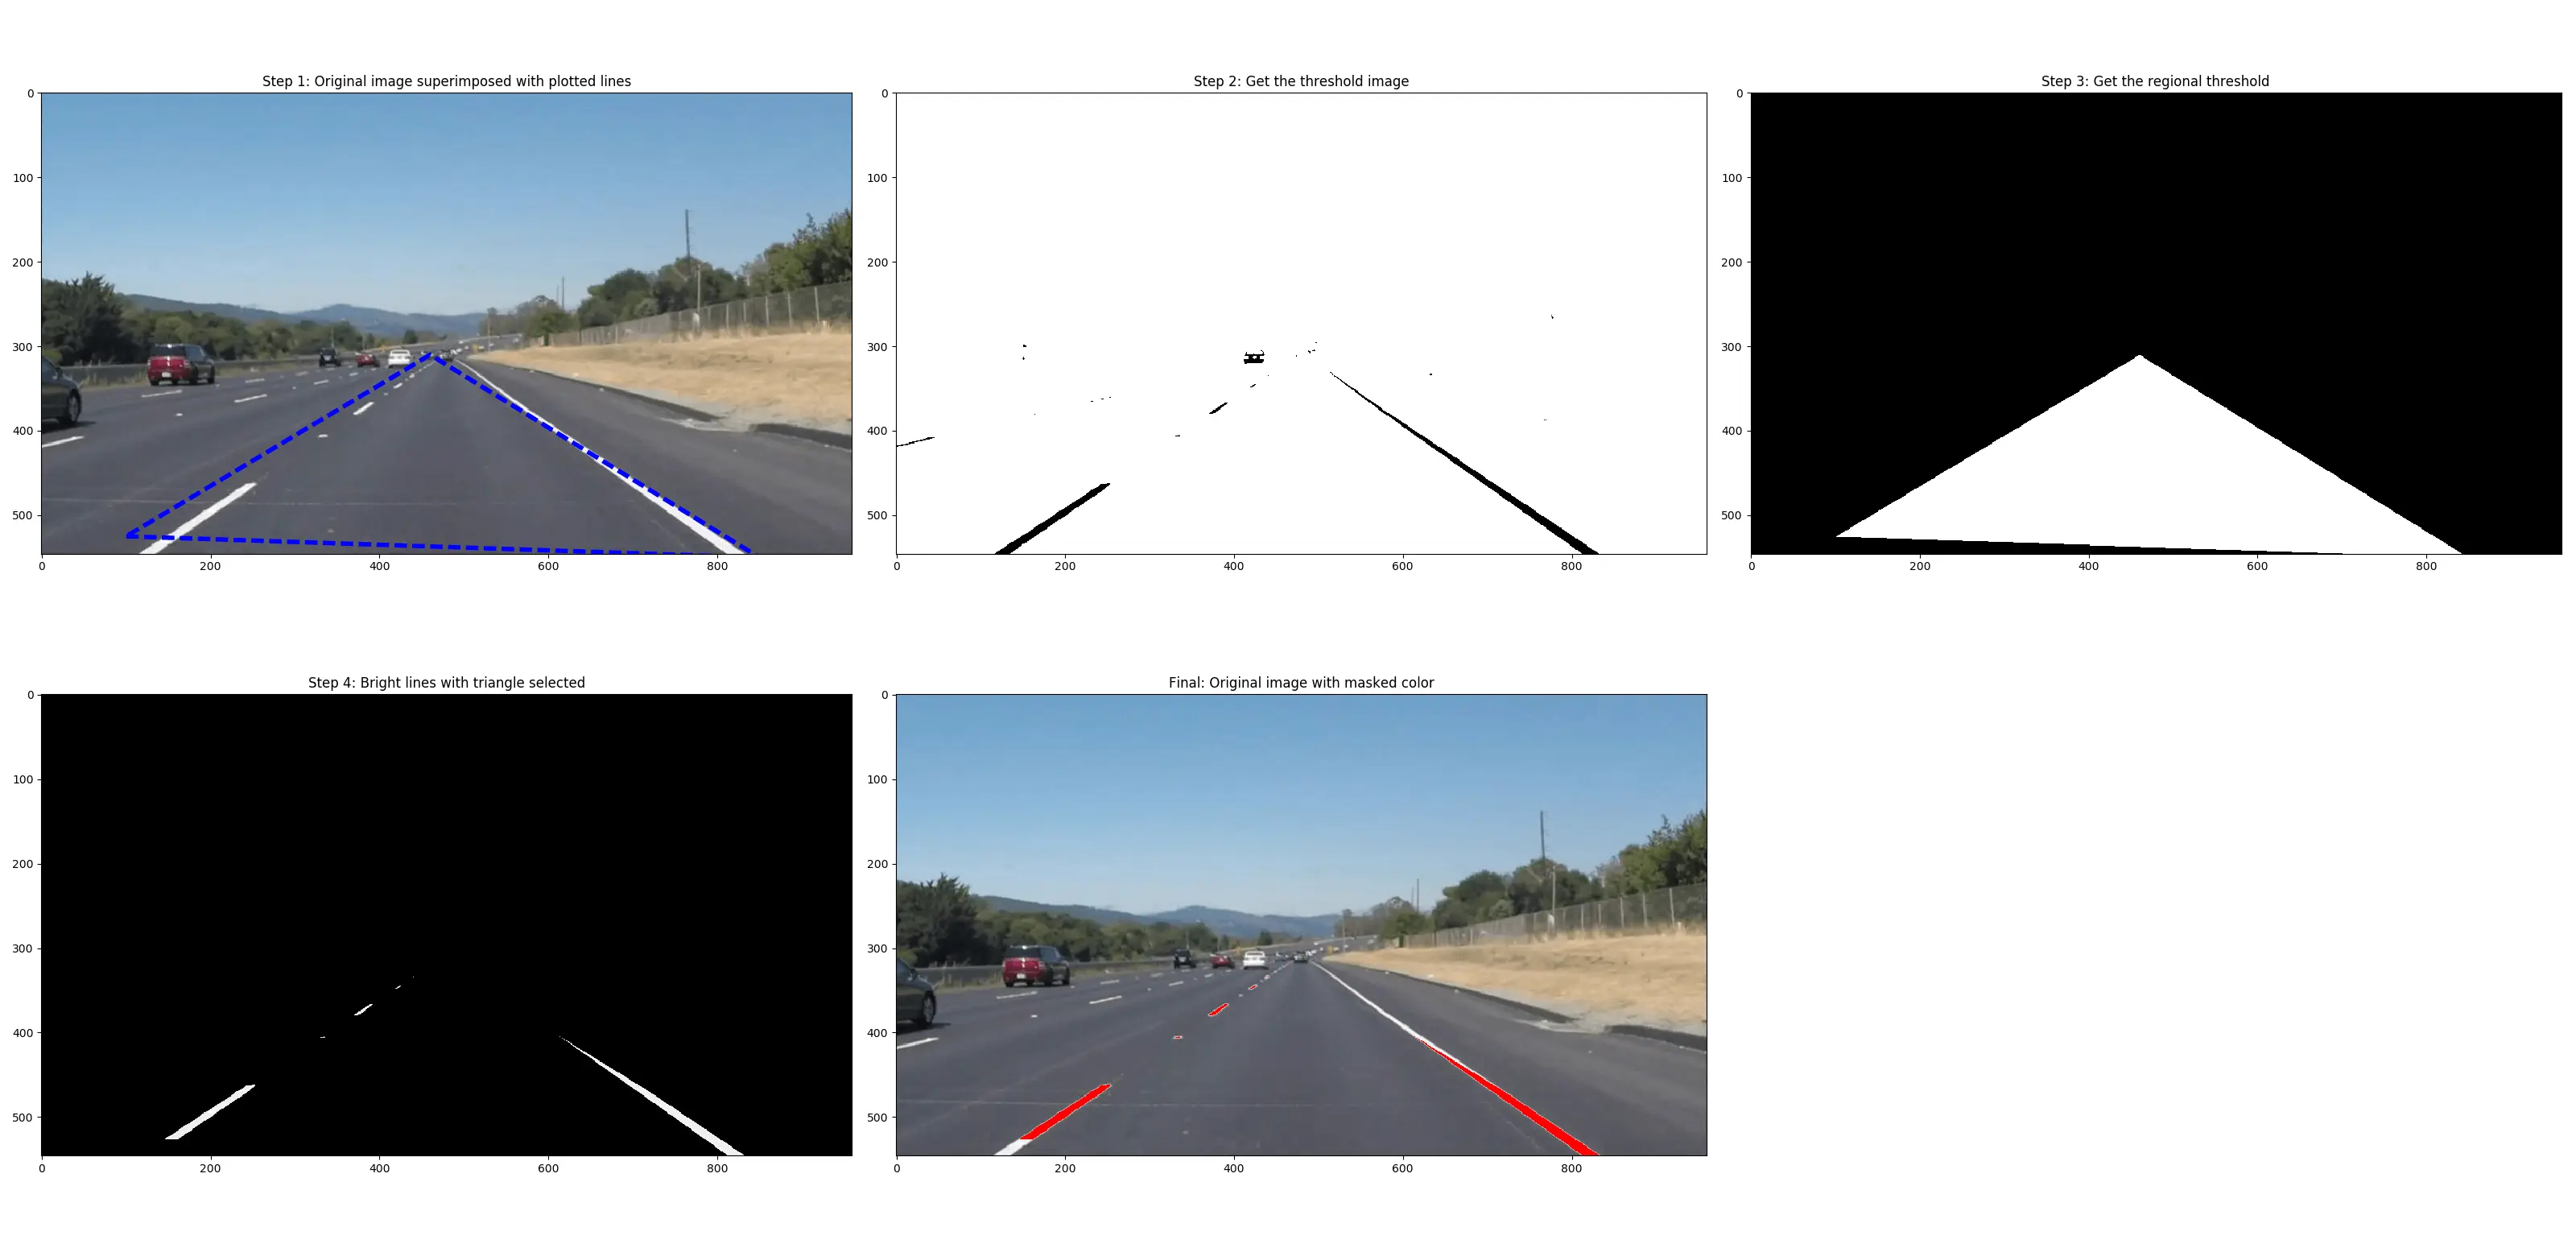
And finally, plot them
    # Show figures
    f = plt.figure()
    x = [left_bottom[0], right_bottom[0], apex[0], left_bottom[0]]
    y = [left_bottom[1], right_bottom[1], apex[1], left_bottom[1]]

    f.add_subplot(2, 3, 1)
    plt.plot(x, y, 'b--', lw=4)
    plt.imshow(image)  # Image superimposed with plotted lines
    plt.title("Step 1: Original image superimposed with plotted lines")

    f.add_subplot(2, 3, 2)
    plt.imshow(color_thresholds, cmap='gray')
    plt.title("Step 2: Get the threshold image")

    f.add_subplot(2, 3, 3)
    plt.imshow(region_thresholds, cmap='gray')
    plt.title("Step 3: Get the regional threshold")

    f.add_subplot(2, 3, 4)
    plt.imshow(color_select)  # bright color line with triangle
    plt.title("Step 4: Bright lines with triangle selected")

    f.add_subplot(2, 3, 5)
    plt.imshow(line_image)  # Masked image
    plt.title("Final: Original image with masked color")

    plt.show()
2.1 Complete Code
    import matplotlib.pyplot as plt
    import matplotlib.image as mpimg
    import numpy as np
    import sys

    try:
        image = mpimg.imread('test.jpg')
    except FileNotFoundError as e:
        print(e)
        sys.exit(1)
    print('This image is: {}, with dimensions: {}'.format(type(image), image.shape))

    ysize = image.shape[0]
    xsize = image.shape[1]
    color_select = np.copy(image)
    line_image = np.copy(image)

    red_threshold = 200
    green_threshold = 200
    blue_threshold = 200
    rgb_threshold = [red_threshold, green_threshold, blue_threshold]

    # Init a triangle (this part is variable)
    left_bottom = [100, 525]  # [0, 539]
    right_bottom = [850, 550]  # [900, 539]
    apex = [460, 310]  # [475, 320]

    # See https://docs.scipy.org/doc/numpy/reference/generated/numpy.polyfit.html for more info
    fit_left = np.polyfit((left_bottom[0], apex[0]), (left_bottom[1], apex[1]), 1)
    fit_right = np.polyfit((right_bottom[0], apex[0]), (right_bottom[1], apex[1]), 1)
    fit_bottom = np.polyfit((left_bottom[0], right_bottom[0]), (left_bottom[1], right_bottom[1]), 1)

    color_thresholds = (image[:, :, 0] < rgb_threshold[0]) | (image[:, :, 1] < rgb_threshold[1]) | (
    image[:, :, 2] < rgb_threshold[2])

    # See https://docs.scipy.org/doc/numpy/reference/generated/numpy.meshgrid.html for more info
    xx, yy = np.meshgrid(np.arange(0, xsize), np.arange(0, ysize))
    region_thresholds = (yy > (xx * fit_left[0] + fit_left[1])) & (yy > (xx * fit_right[0] + fit_right[1])) & (
    yy < (xx * fit_bottom[0] + fit_bottom[1]))

    # Mask color selection
    color_select[color_thresholds | ~region_thresholds] = [0, 0, 0]
    # Find where image is both colored right and in the region
    line_image[~color_thresholds & region_thresholds] = [255, 0, 0]

    # Show figures
    f = plt.figure()
    x = [left_bottom[0], right_bottom[0], apex[0], left_bottom[0]]
    y = [left_bottom[1], right_bottom[1], apex[1], left_bottom[1]]

    f.add_subplot(2, 3, 1)
    plt.plot(x, y, 'b--', lw=4)
    plt.imshow(image)  # Image superimposed with plotted lines
    plt.title("Step 1: Original image superimposed with plotted lines")

    f.add_subplot(2, 3, 2)
    plt.imshow(color_thresholds, cmap='gray')
    plt.title("Step 2: Get the threshold image")

    f.add_subplot(2, 3, 3)
    plt.imshow(region_thresholds, cmap='gray')
    plt.title("Step 3: Get the regional threshold")

    f.add_subplot(2, 3, 4)
    plt.imshow(color_select)  # bright color line with triangle
    plt.title("Step 4: Bright lines with triangle selected")

    f.add_subplot(2, 3, 5)
    plt.imshow(line_image)  # Masked image
    plt.title("Final: Original image with masked color")

    plt.show()
2.2 Output
Masking and region colouring:
Masking regions
3. What’s Next?
Canny edge detection, which looks something like:

